
Traffic Inspection
The Traffic view is the heart of Madhyamas. It shows every HTTP/HTTPS request and response flowing through the proxy in real time, with full details on headers, bodies, timing, and more.
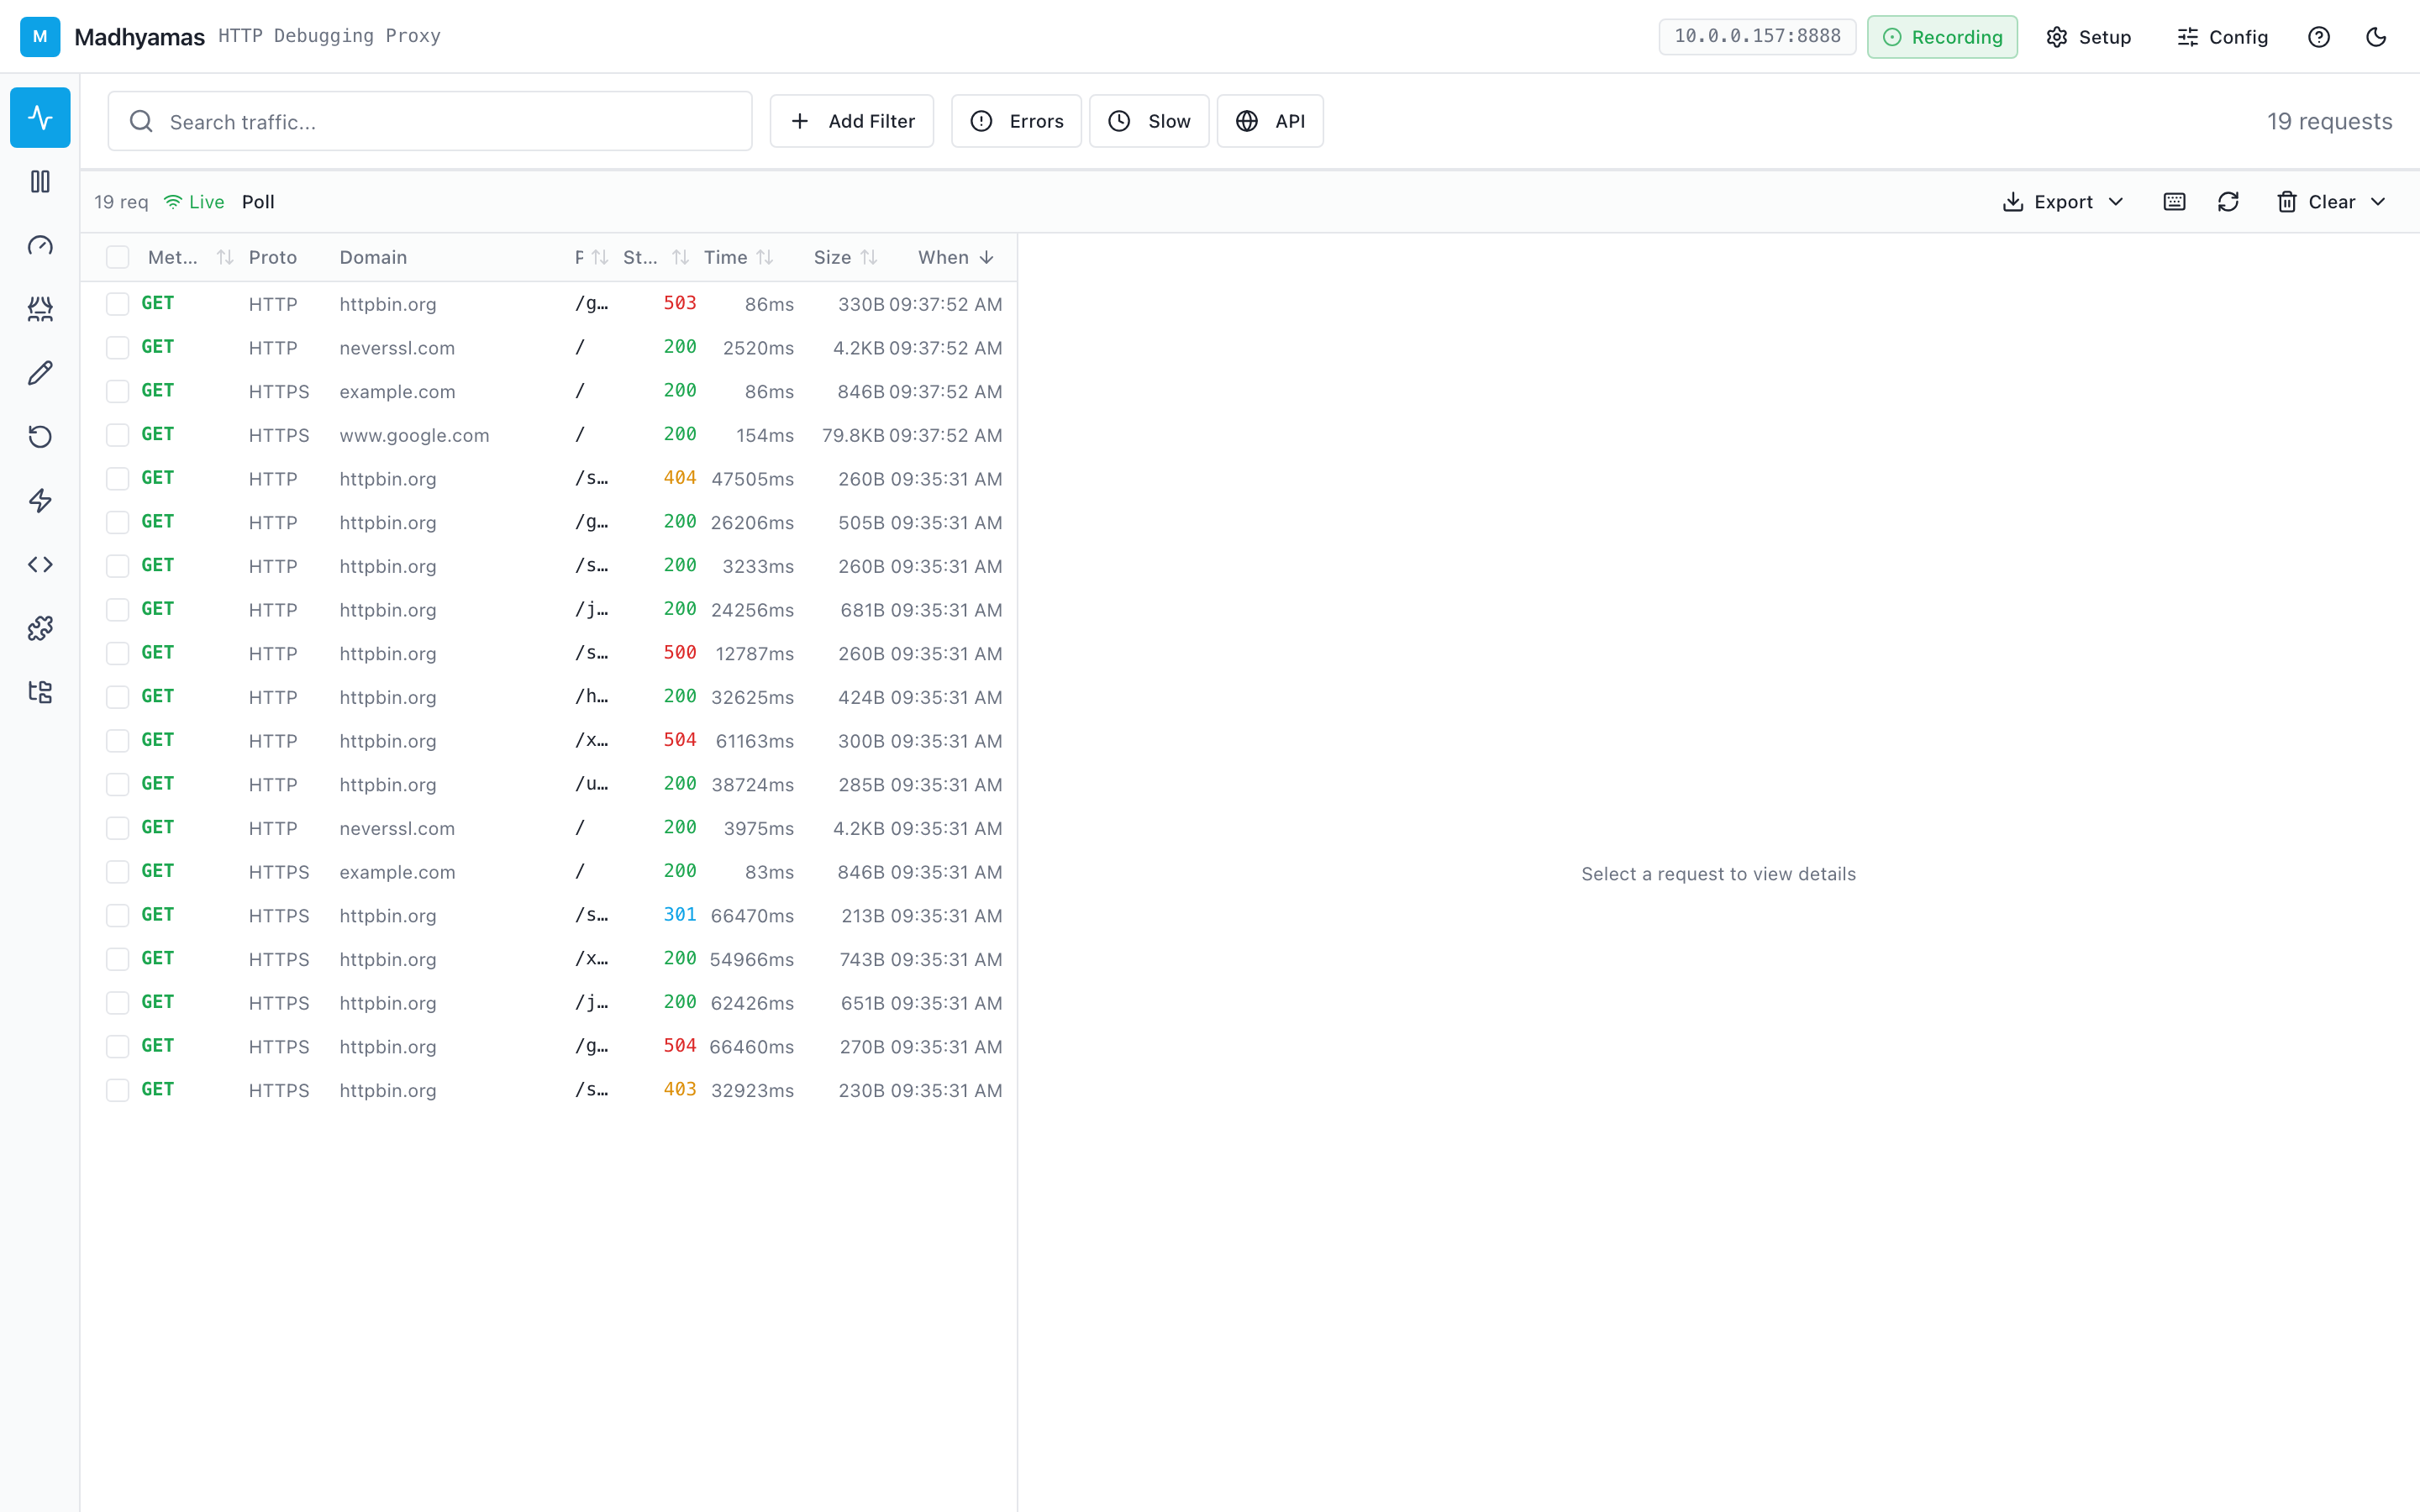
Understanding the Traffic List
Each row in the traffic list represents a single HTTP transaction. The columns show:
| Column | Description |
|---|---|
| Method | HTTP method (GET, POST, PUT, DELETE, etc.) — color-coded |
| Proto | Protocol (HTTP or HTTPS) |
| Domain | Server hostname |
| Path | URL path |
| Status | HTTP response status code — color-coded by category |
| MIME | Response content type |
| Size | Response body size |
| Time | Request duration |
| Timestamp | When the request was made |
Status Code Colors
- Green (2xx): Success
- Yellow (3xx): Redirect
- Orange (4xx): Client error
- Red (5xx): Server error
Viewing Request Details
Click any traffic row to see the full request and response details in the detail panel on the right side of the screen.
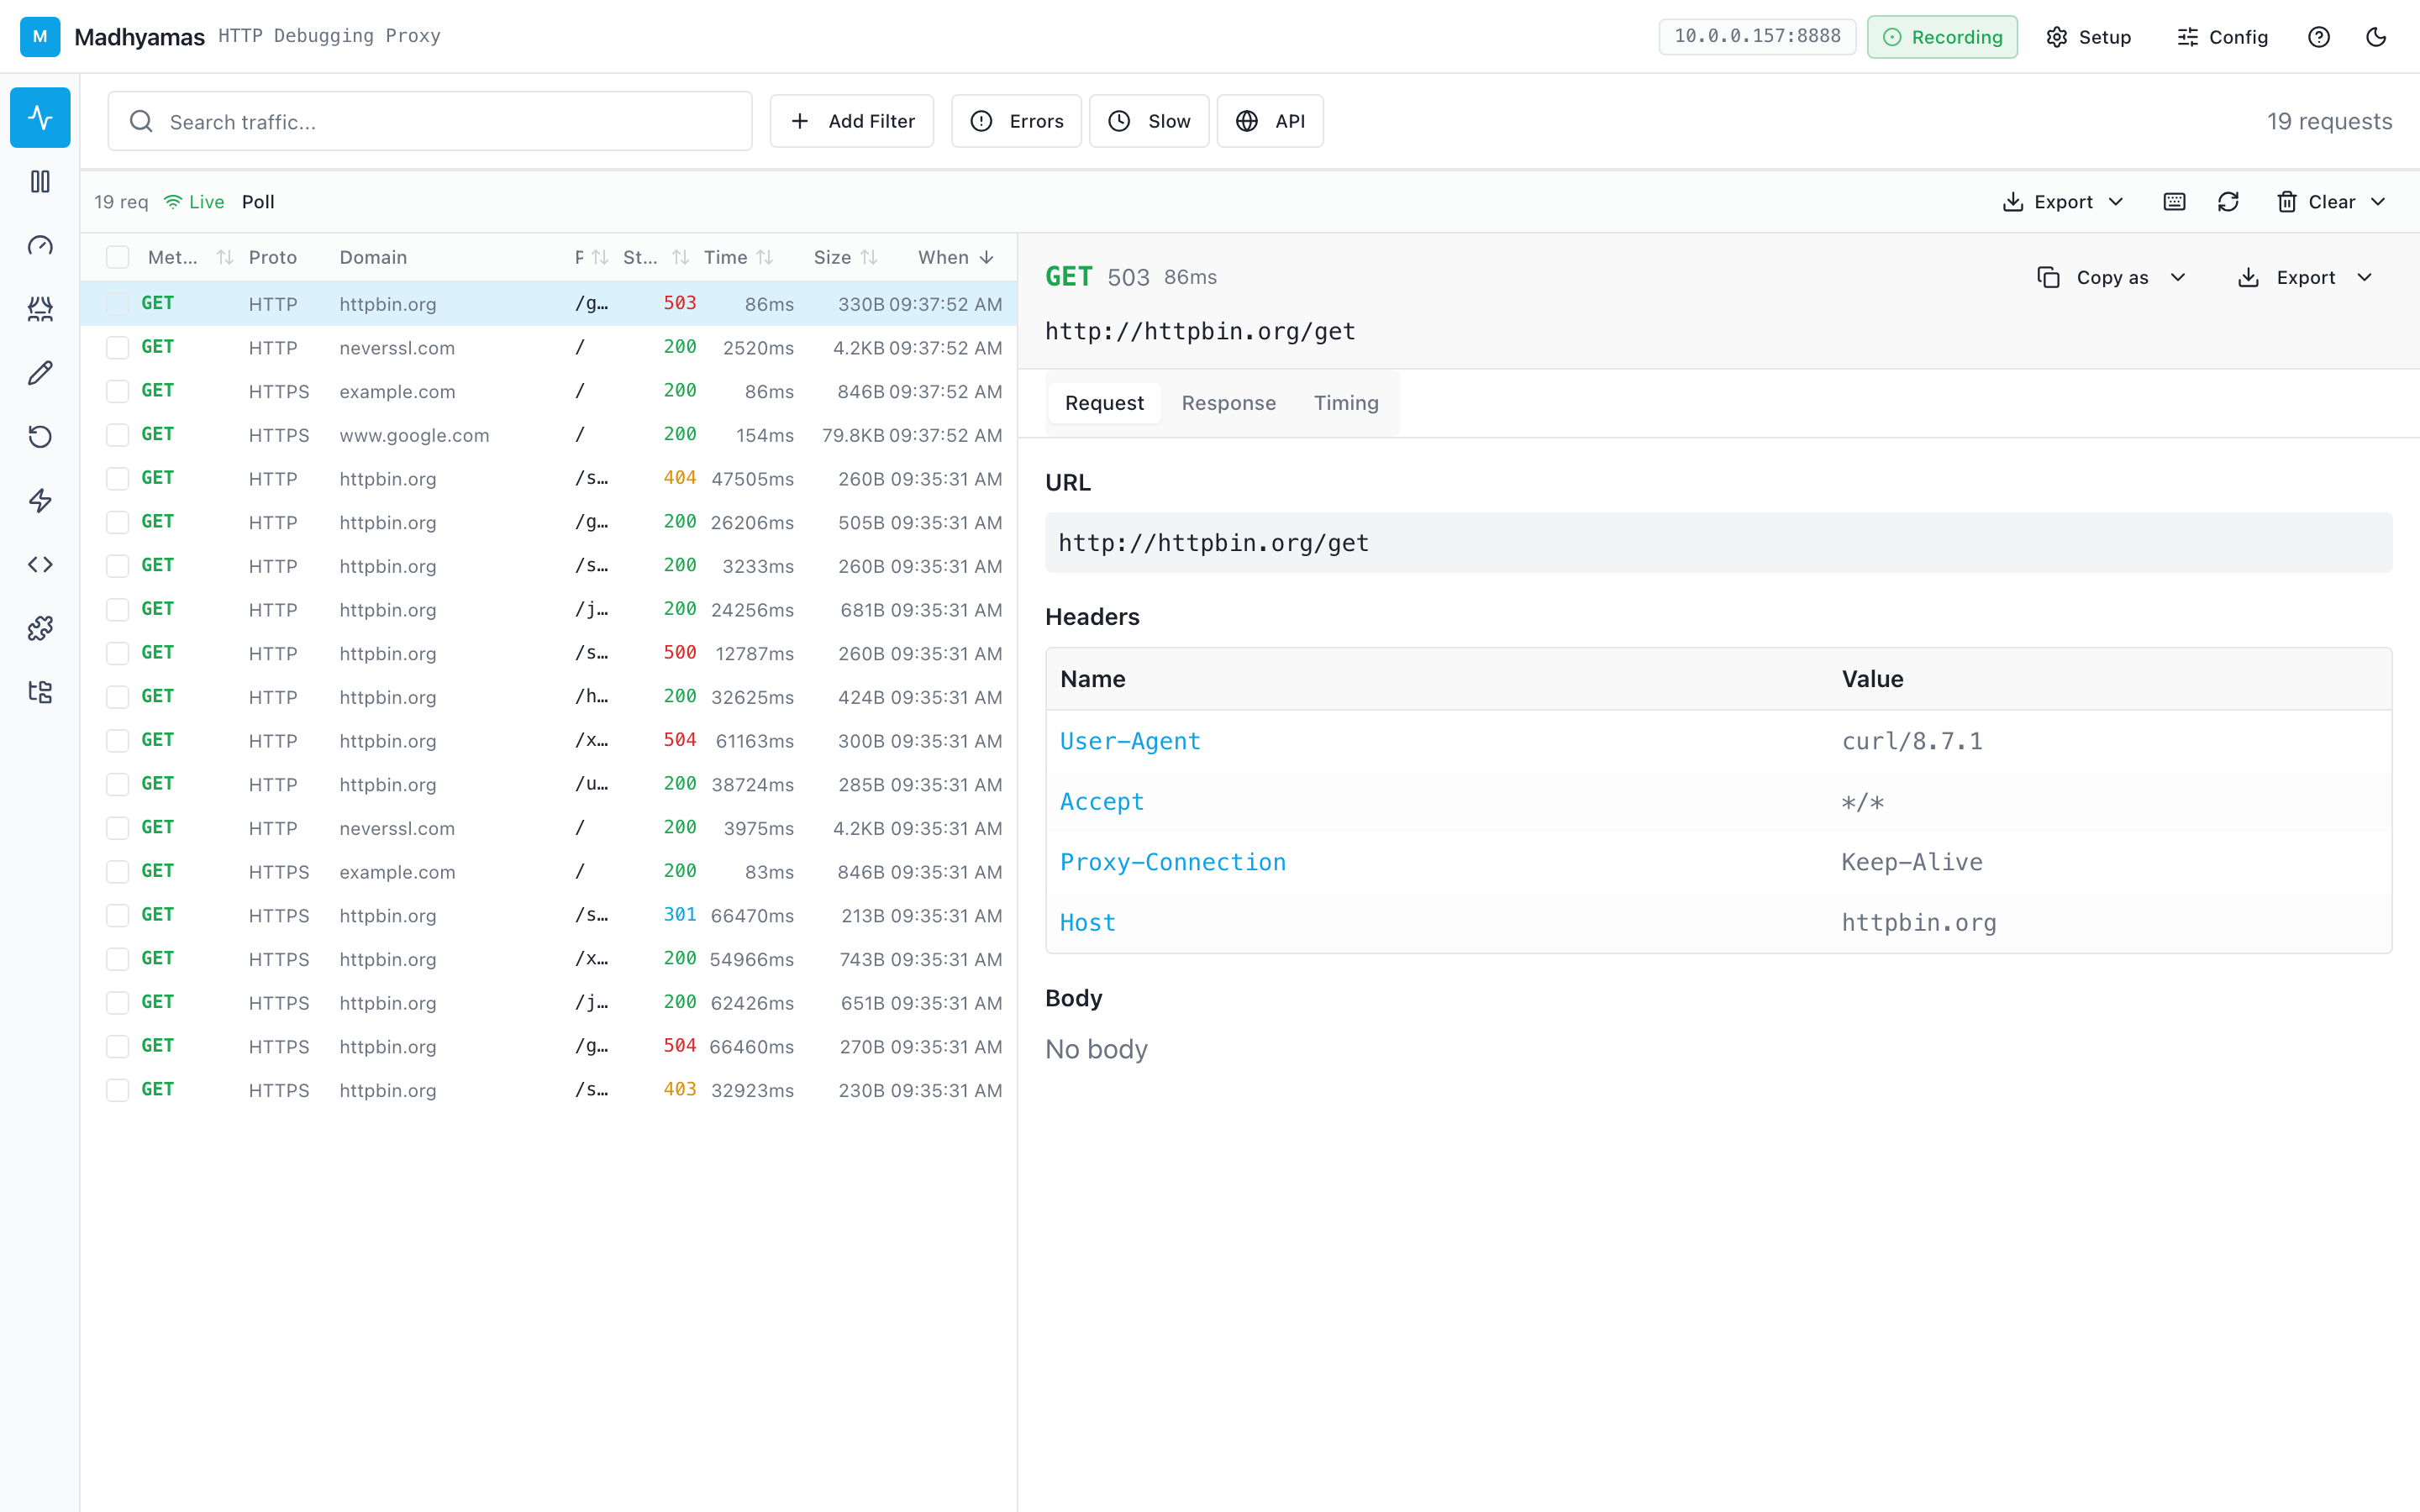
The detail panel includes tabs for:
- Request: Method, URL, headers, query parameters, and body
- Response: Status code, headers, and body (with syntax highlighting for JSON, XML, HTML)
- Timing: Connection, TLS, and transfer timing breakdown
- Preview: Rendered preview for HTML, images, and JSON
Compressed Response Bodies
Madhyamas stores raw compressed response bodies (the Content-Encoding header is preserved) and decompresses them on demand when you view the decoded content. This preserves the original compressed bytes — useful for debugging compression issues — while still letting you inspect the decoded content.
Supported content encodings: gzip, deflate, brotli, and zstd (Zstandard). In the body viewer, a Decompressed toggle (enabled by default for compressed responses) switches between the decoded view and the raw compressed data. A zstd badge appears when the encoding is zstd, indicating backend decompression is being used.
Timeline (Waterfall) View
In addition to the list view, the traffic panel has a Timeline toggle that switches to a waterfall chart. Each request is shown as a horizontal bar positioned by start time and sized by duration, making it easy to spot slow requests, parallel downloads, and overlapping calls at a glance. See the Timeline View guide for details.
Focus
The Focus feature highlights traffic from specific hosts without hiding the rest. Matching rows get a yellow border and star icon while non-matching rows are dimmed — useful for spotting a specific service in a busy stream. See the Focus guide for details.
Filtering Traffic
Madhyamas provides powerful filtering to help you find specific requests among potentially thousands of captured entries.
Quick Filters
The toolbar above the traffic list includes one-click filter buttons:
- Errors: Show only requests with 4xx and 5xx status codes
- Slow: Show only requests that took longer than 1 second
- API: Show only API calls (JSON/XML responses)
- Poll: Show only polling requests (repeated requests to the same URL)
Text Search
Use the search bar to filter by any text — URL, header name, header value, or body content. The search is case-insensitive and matches anywhere in the request or response.
Advanced Filter Builder
Click Add Filter to create structured filters with specific fields, operators, and values. You can combine multiple filters with AND/OR logic.
Sorting
Click any column header to sort by that column. Click again to reverse the sort order. The default sort is by timestamp (newest first).
Exporting Traffic
Export as HAR
HAR (HTTP Archive) is a standard format for storing HTTP transactions. Click the Export button and choose "Export as HAR" to download a .har file that can be opened in browser DevTools, Charles Proxy, or other HAR-compatible tools.
Export as cURL
Right-click any traffic entry and select "Copy as cURL" to get a curl command that reproduces the request. This is useful for reproducing issues or sharing with colleagues.
Export Selected Only
Select specific rows using the checkboxes on the left, then export only the selected entries.
Clearing Traffic
Click the Clear button to remove all captured traffic. This action cannot be undone. If you want to preserve traffic before clearing, export it first or save it to a Session.
Real-Time Updates
The traffic list updates in real time as new requests flow through the proxy. A WebSocket connection keeps the UI in sync — no manual refresh needed.
If you need to pause recording without stopping the proxy, toggle the Recording button in the top toolbar to switch to Passthrough mode. In passthrough, traffic still flows through the proxy but isn't recorded.
See also
- Timeline View — waterfall visualization of captured traffic
- Focus — highlight specific hosts without filtering
- Sessions — organize traffic into named groups
- Importing HAR Files — bring external captures into Madhyamas
- WebSocket Inspection — bidirectional WebSocket traffic
- REST API reference —
/api/trafficendpoints